Starbucks Mobile App: How to Send Right Offer to Right Person

I wanna collect starrrrrrs
Build machine learning models to predict whether or not someone will respond to a Starbucks mobile app offer.
Table of Contents
Introduction
Once every few days, Starbucks sends out an offer to users of the mobile app. Not all users receive the same offer and not all users take advantage of the offer they were given. The data set used for this article contains data that mimics customer behavior on the Starbucks rewards mobile app.
We will build models to predict whether a customer will make use of the offer and dig into the data to find insights about Starbucks mobile app offer.
Data Preparation
The data is contained in three files:
- portfolio.json — containing offer ids and meta data about each offer (duration, type, etc.)
- profile.json — demographic data for each customer
- transcript.json — records for transactions, offers received, offers viewed, and offers completed
Build an ETL workflow by loading the data sets into an SQLite database. The script is as below.
@click.command()
@click.argument('input_filepath', type=click.Path(exists=True))
@click.argument('output_filepath', type=click.Path())
def main(input_filepath, output_filepath):
    """
    Runs scripts to turn raw data from (../raw) into
    a queryable/indexable form (an SQL database saved in ../raw).

    Parameters
    ----------
    input_filepath: str
        The file location of the input data.
    output_filepath: str
        The file location of the output SQLite database.

    Returns
    -------
    None
    """
    logger = logging.getLogger(__name__)
    logger.info('making database from raw data')

    raw_data_files = [filename for filename in os.listdir(input_filepath)
                      if filename.endswith('json')]

    db_path = os.path.join(output_filepath, 'raw_data.sqlite')
    e = sa.create_engine('sqlite:///' + db_path)
    for raw_data_file in sorted(raw_data_files):
        df = pd.read_json(f'{input_filepath}/{raw_data_file}',
                    orient='records', lines=True)
        for col in list(df):
            if df[col].dtype == object:
                df[col] = df[col].astype('str')

        table_name = raw_data_file.split('.')[0]
        df.to_sql(table_name, e, index=False)
        logger.info(f'table {table_name} created')
Then pull data from the database and preprocess the data by handling missing values, creating dummy variables, extracting information, etc. The cleaned output looks like this.

The response variable we are going to predict is “is_offer_used”.
Exploratory Analysis
Utilization Rate
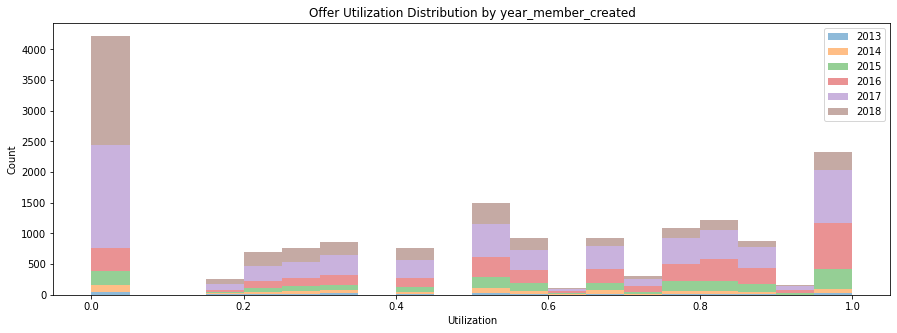
Users who created their account in 2018 are more likely to not use the offer than other users. Users becoming a member in 2016 have a higher utilization rate of offer. Members created in different year might have different motivations and this could be shown in how they use the offer after they joined the membership.
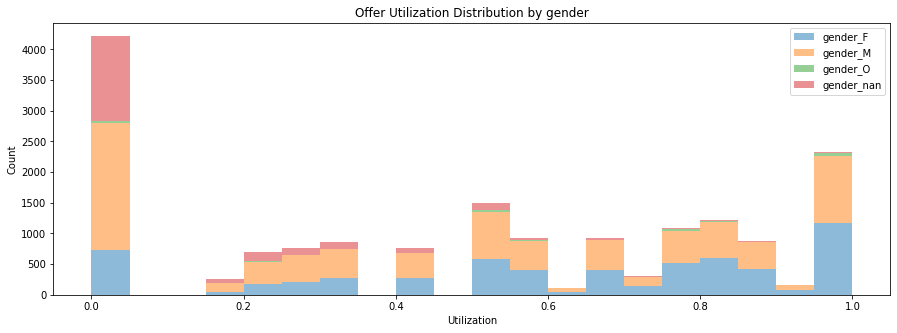
The Male user prefers not using the offer. It is also interesting to see most of users who didn’t provide their gender information also didn’t like to leverage the offer.
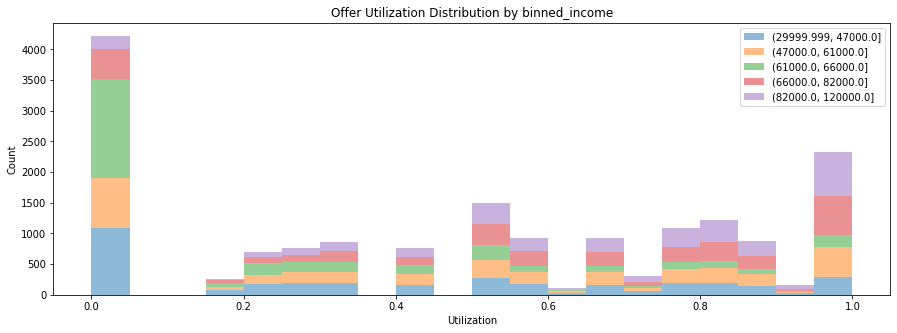
People with the highest income are the most active group to use the offer as they have a very high utilization rate. (Ha, rich people do not give up the chance to manage money even for a cup of coffee)
Funnel Analysis
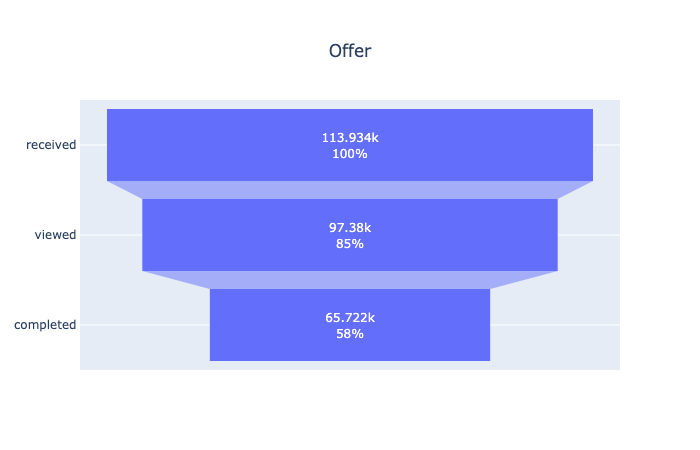
This funnel plot suggests that most of users will take a look at their offer and more than half of them will use it. It can be broken down into more sections.
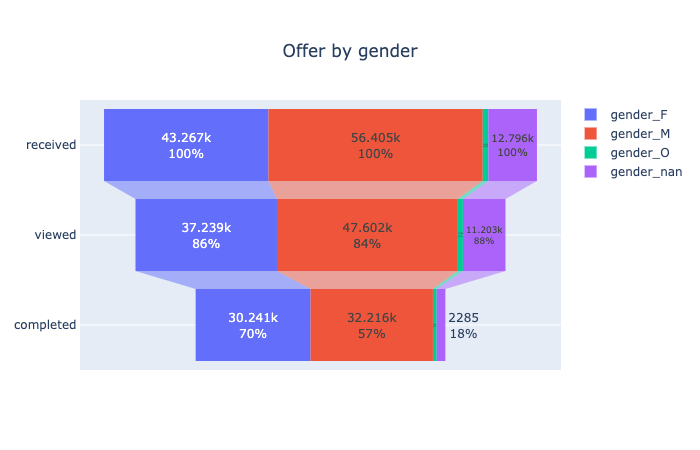
It looks like female users are more likely to complete the order with offer as their completion rate is 13% higher than male users. To have a stronger conclusion, we may need more tests like hypothesis tests for different genders.
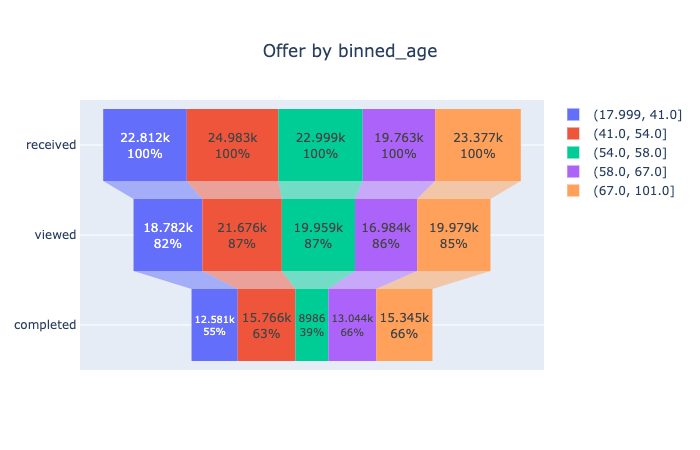
Each group has a close view rate. However, users whose age are from 54 to 58 have the lowest completion rate. May need more research to find out why.
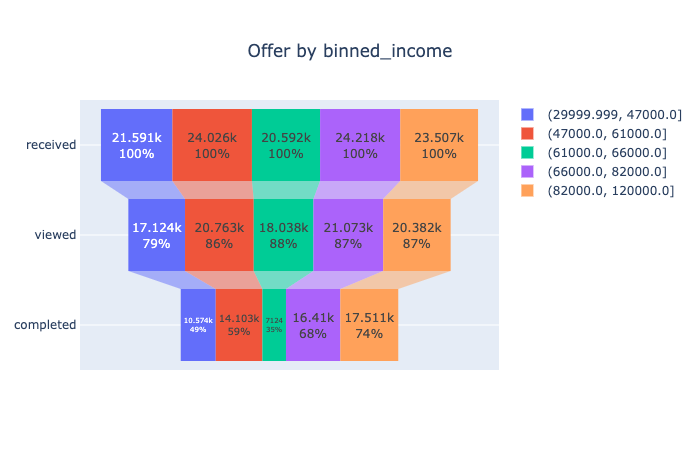
People whose salaries are from 61k to 66k have the lowest completion rate. People whose salaries are below 47k have the lowest view rate. And it is not unexpected that people with the salary above 82k have the highest completion rate.
Transaction
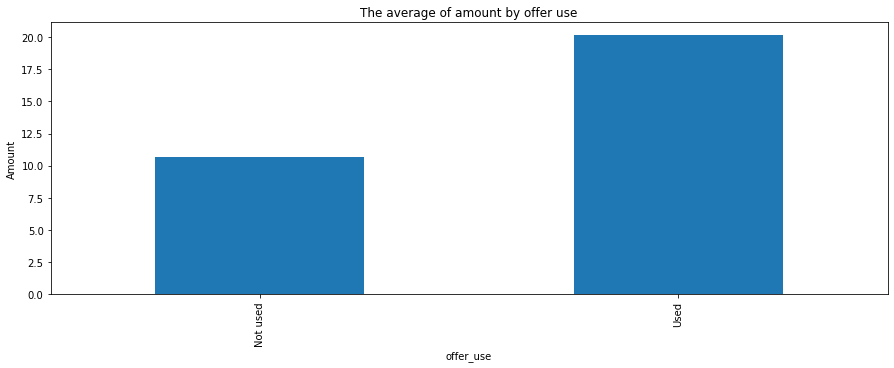
In average, the amount of orders completed with offer is nearly two times as large as the orders without offer.
Feature Importance
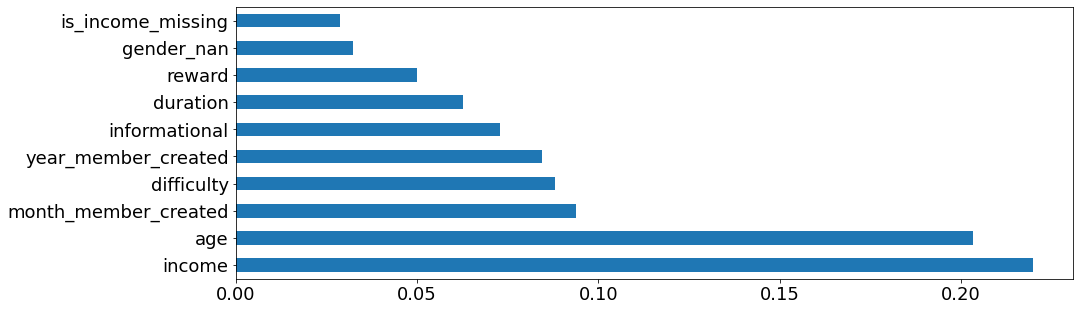
As shown above, we can see the most important factors that decide whether the offer will be used are income and age, which are in line with the findings we discussed in Exploratory Analysis.
Model Building
Two models are used to predict whether offer is used in addition to the model of Majority Vote Classifier. Classification report is used to evaluate the model as it includes accuracy, precision, recall and f1-score.
Metrics
We will evaluate the performance of model based on accuracy and f1-score.
Accuracy
It is the measure of all the correctly identified cases.
Accuracy = (True Positives + True Negatives) / (True Positives + False Positives + True Negatives + False Negatives)
F1-Score
It is the weighted average of Precision and Recall.
Precision = True Positives/(True Positives + False Positives)
Recall = True Positives/(True Positives + False Negatives)
F1-Score = 2*(Recall * Precision) / (Recall + Precision)
This metric has a good balance between Precision and Recall, thus it gives a better measure of the incorrectly classified cases than the Accuracy.
We’ll consider both metrics as we do not have a preference on the measure of the incorrectly classified.
Steps
Load cleaned data from the csv file
Shuffle and split the data into training and testing data set using the function
def data_preparation(df, y, test_size=0.2, random_state=0):
    """
    Standardize data then permute and split DataFrame index into train and test.

    Parameters
    ----------
    df: pandas.DataFrame
        The dataset to be split into train and test set
    y: str
        The name of response variable
    test_size: float
        Fraction between 0.0 and 1.0
    random_state: int

    Returns
    -------
    tuple of numpy.ndarray,
        X_train, X_test, y_train, y_test
    """

    logging.info("Splitting the data-frame into train and test parts")

    X_train, X_test, y_train, y_test = train_test_split(
        df.drop([y], axis=1).values,
        df[y].values,
        test_size=test_size,
        random_state=random_state
    )
    return X_train, X_test, y_train, y_test
Create pipelines to train each model
Majority Vote Classifier
It works as a naive predictor assuming all offers are used regardless of any features. The performance of this model would be a benchmark to compare with other classifiers.
Build a class compatible with the SciKit-Learn model classes
class MajorityVoteClassifier:
    """
    A class contains the `fit` and `predict` methods that are compatible
    with the SciKit-Learn model classes.

    Attributes
    ----------
    majority_vote: int
        The mode of target values.

    Methods
    ----------
    fit(X, y)
        Fit the model to a training data set.
    predict(X)
        Make predictions with the trained model.
    """

    def __init__(self):
        self.majority_vote = None

    def fit(self, X, y):
        from statistics import mode

        self.majority_vote = mode(y)
        return self

    def predict(self, X):
        if self.majority_vote is None:
            raise ValueError("The majority vote classifier has to be trained \
                                before making predictions")
        return [self.majority_vote] * len(X)
Build a function to make predictions using Majority Vote Classifier
def run_majority_vote(X_train, y_train):
    """
    Use the majority vote to predict survival.

    Parameters
    ----------
    X_train: numpy.ndarray
        A subset to train a model.
    y_train: numpy.ndarray
        A subset to test the trained model.

    Returns
    -------
    classifier
        Fitted estimator
    """

    logging.info("Running the majority vote classifier")

    majority_vote_classifier = MajorityVoteClassifier()
    majority_vote_classifier.fit(X_train, y_train)

    return majority_vote_classifier
Logistic Regression
Standardize the data and fit the model to the sampled training data with Grid Search and Cross Validation.
def run_logistic_regression(X_train, y_train):
    """
    Use ridge logistic regression to train model.
    The ridge parameter is found using 5-fold cross-validation.

    Parameters
    ----------
    X_train: numpy.ndarray
        A subset to train a model.
    y_train: numpy.ndarray
        A subset to test the trained model.

    Returns
    -------
    classifier
        Fitted estimator
    """

    logging.info("Running the ridge logistic regression classifier")

    from sklearn.linear_model import LogisticRegression

    pipeline = Pipeline([
        ('scale', StandardScaler()),
        ('clf', LogisticRegression(solver='liblinear', random_state=0))
    ])

    param_grid = {
        'clf__penalty': ['l1', 'l2'],
        'clf__C': np.logspace(-4, 4, 20)
    }

    cv = GridSearchCV(
        pipeline,
        param_grid=param_grid,
        cv = 5,
        verbose=False)

    cv.fit(X_train, y_train)

    return cv
Random Forest
Fit the learner to the sampled training data with Grid Search and Cross Validation. Even though the Random Forest does not require data scaling, I still included it for the model efficiency.
def run_random_forest(X_train, y_train):
    """
    Use random forest to train model.
    The max_features parameter is found using 5-fold cross-validation.

    Parameters
    ----------
    X_train: numpy.ndarray
        A subset to train a model.
    y_train: numpy.ndarray
        A subset to test the trained model.

    Returns
    -------
    classifier
        Fitted estimator
    """

    logging.info("Running the random forest classifier")

    from sklearn.ensemble import RandomForestClassifier

    pipeline = Pipeline([
        ('scale', StandardScaler()),
        ('clf', RandomForestClassifier(criterion='gini', random_state=0))
    ])

    param_grid = [
        {'clf' : [RandomForestClassifier()],
        'clf__n_estimators' : [10, 50, 100]}
    ]

    cv = GridSearchCV(
        pipeline,
        param_grid = param_grid,
        cv=5,
        verbose=False)

    cv.fit(X_train, y_train)

    return cv
Make predictions on the testing data set and calculate accuracy and f1-score
def build_classification_report(model, y_test, X_test):
    """
    Build a text report showing the main classification metrics.

    Parameters
    ----------
    model: classifier
        The dataset to be split into train and test set
    y_test: numpy.ndarray
        Correct target values.
    X_test: numpy.ndarray
        Data set used to estimate targets.

    Returns
    -------
    string
        Text summary of the precision, recall, F1 score for each class.
    """

    return classification_report(y_true=y_test, y_pred=model.predict(X_test))
Performance
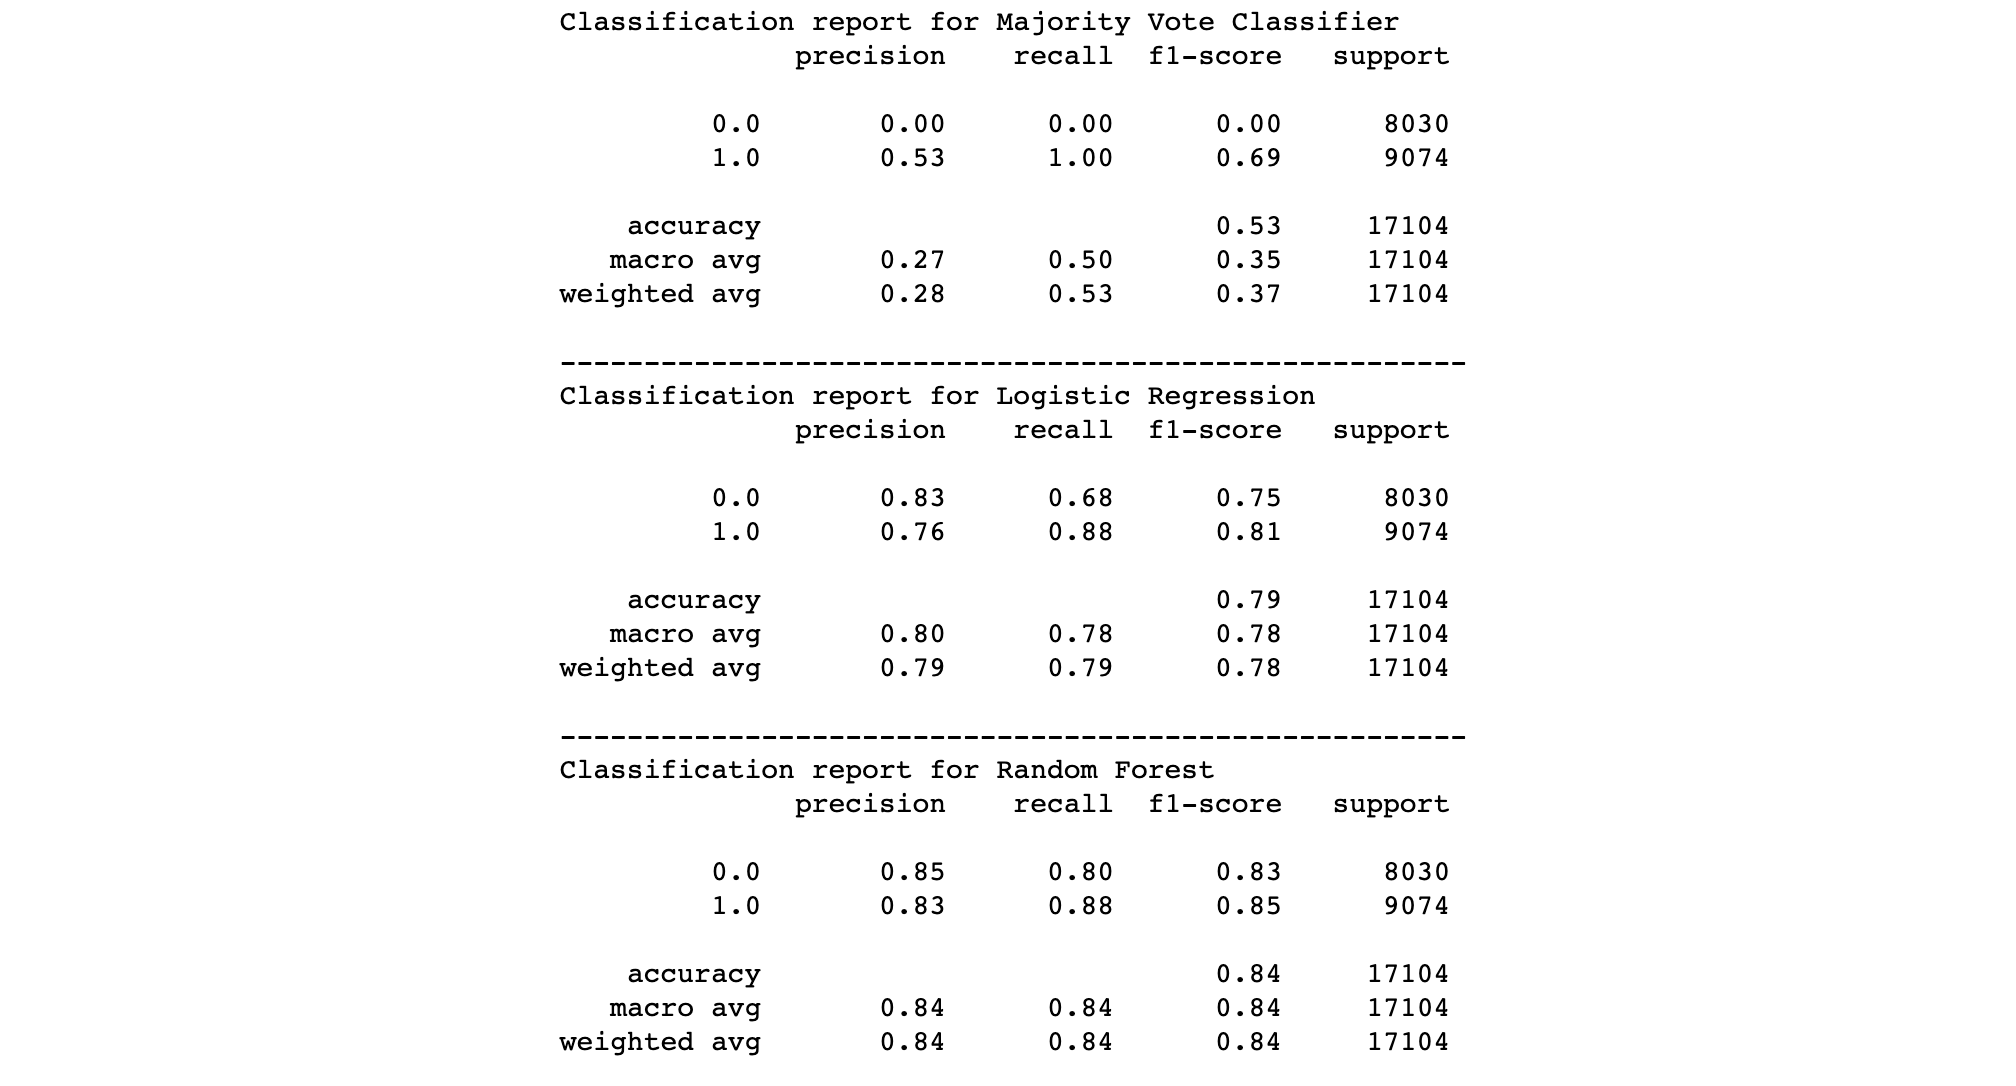
The classification report suggests that the Naive Majority Vote Classifier has an accuracy of 0.53 and f1-score of 0.35, the Logistic Regression has an accuracy of 0.79 and an f1-score of 0.78 and the Random Forest model has an accuracy of 0.84 and an f1-score of 0.84. Both machine learning models we built have beaten the benchmark and we chose the Random Forest as it shows a better performance on test data set.
Conclusion
The goal of this article is to provide data insights and build Machine Learning models to predict whether a customer will respond to an offer. There are three steps for me to achieve it. First, I built the ETL pipeline to prepare data. Second, I did the exploratory data analysis to dig into utilization rates, funnels of offer and transactions. In the end, after building Logistic Regression and Random Forest models and comparing their performances, I suggesed the latter as our choice to make predictions.
Next Steps
More effort can be put into feature engineering. With regard to missing values, it is worth giving a shot to handle them using classifiers like K-Nearest Neighbors. We can try to remove some features or reduce the dimensions using PCA to see how it will affect the performance. We can also delve into the existing features and see what else we can extract from them.
What’s more, instead of building binary classification models, we can do clustering analysis with unsupervised learning algorithms. Thus, we can inspect the characteristics of groups who are more likely to respond to offers or something else we are interested in.
To see more about this analysis, check the link to my Github available here.